If I had to cut soccer bet research down to one line, it would be this: I check form, match setting, team news, and then pick the market – in that order.
That gives me a far better read than looking at league position or odds alone. It helps me spot things like a strong home side, a tired away team after midweek travel, or a missing goalkeeper that could change the whole match.
Before I bet, I focus on:
- Recent form over the last 5 to 10 matches
- Home vs away results, not just the full record
- Goals scored and conceded
- Shots on target and clean sheets
- H2H from the last 3 to 5 meetings
- Motivation, like title pressure or a relegation fight
- Injuries, suspensions, and rotation
- Which market suits the data, instead of forcing a match-result pick
A few numbers matter here. Odds of 2,00 imply a 50% chance. Odds of 3,00 imply 33,3%. And with about 25% of PSL matches ending in a draw, I know I should be careful about forcing a straight 1X2 bet when the matchup looks tight.
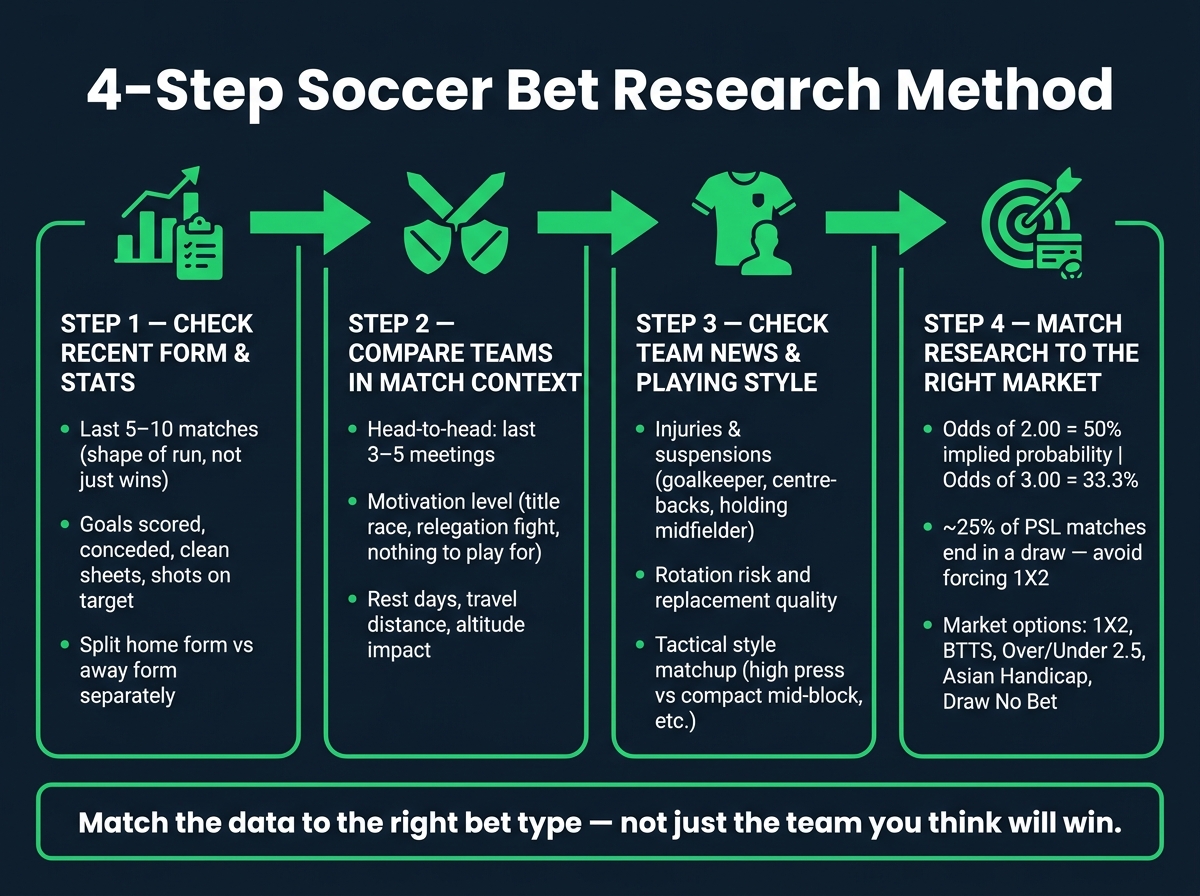
4-Step Soccer Bet Research Method
THIS "Secret Prediction" Strategy Will Make You a Profitable Bettor in 2026…
sbb-itb-00c3b18
Quick comparison
| Research area | What I look for | What it can point to |
|---|---|---|
| Form | Last 5 to 10 results, scoring runs | Team momentum or poor run |
| Venue split | Home form vs away form | Stronger 1X2 or Double Chance angle |
| Goal data | Goals for, goals against, clean sheets | Over/Under 2.5, BTTS |
| H2H | Last 3 to 5 meetings | Fixture pattern, if squads are still similar |
| Match setting | Rest days, travel, pressure | Late drop-off, lower tempo, upset risk |
| Team news | Missing spine players, rotation | Shift in goal or result markets |
| Market fit | Best bet type for the pattern | Better line than a forced pick |
My aim is simple: match the data to the right bet type, not just the team I think will win.
Step 1: Check recent form and core team stats
Look at the last five to ten matches to spot momentum. But don’t just count wins and losses. Read the shape of the run.
A spell like L-L-W-W-W says something very different from W-L-W-L-W, even when both teams have the same number of wins. One side may be building rhythm. The other may still be all over the place. Your job here is to find the pattern first, then test it in the next steps. Once you’ve got that pattern, weigh it up against the opponent and the latest team news before you back any market.
Pay close attention to goals scored, goals conceded, clean sheets, and shots on target. Put together, these stats show two simple things: whether a team is making enough chances, and whether the back line is standing up or giving way too often.
Read form by venue, not just overall results
Home and away form often tell the better story, so split them before judging the match. A team can sit nicely on the league table and still be poor away from home. The opposite can also happen.
That home-away split matters because it shapes which markets fit the fixture. A side that looks strong on paper may lose a lot of its edge once it leaves home.
Turn raw stats into match patterns
Stats only help when they point to a pattern. Raw numbers on their own don’t pay out.
For example, a team that keeps frequent clean sheets at home may point you towards Under 2.5 goals or BTTS: No. On the other hand, a side that concedes often away from home shows a weak defence on the road, which can open the door to Over 2.5 or BTTS: Yes angles.
Here’s how to turn those numbers into market signals:
| Statistic | What It Reveals | Suggested Market |
|---|---|---|
| High clean sheet rate | Strong defence | Under 2.5 / BTTS: No |
| High goals conceded | Defensive weakness under pressure | Over 2.5 / BTTS: Yes |
| High shots on target | Attacking pressure | Over 1.5 team goals |
| Frequent draws | Hard to beat | Draw / Double Chance |
Shots on target are especially useful because they show whether a team is building steady pressure and making decent chances. Results can lag for a while, but the shot data may show that a side is moving in the right direction.
Form is only one part of the picture; the next step is to test it against the other team’s context.
Step 2: Compare both teams in match context
Compare both teams within the actual match setting: the opponent, venue, schedule, and what’s on the line. Then test each team’s form against that setting.
How to use head-to-head records
Use H2H to check if this fixture tends to follow a pattern you can trust – repeat scorelines, home-ground control, or matches that are often tight or open. Recent derby or rivalry trends can still count, but only if the squads and coaches are mostly the same. Once there have been major changes in personnel or coaching, older meetings fade fast.
Stick to the last three to five meetings and ask one simple thing: does that pattern still match the current version of both teams?
After H2H, look at whether the match conditions lean towards one side.
Assess motivation, fatigue, and travel demands
Motivation changes how you read form. A must-win team often plays with more risk than a side that only needs a draw. On the other hand, a mid-table team with nothing left to chase may lose a bit of edge.
Travel and fatigue matter too. Long trips between coastal cities and inland venues can take a toll, and high-altitude grounds can drain coastal teams – mainly in the second half. That matters even more when a team has had a short gap between matches. These details can change the tempo and lead to late-game drop-off, which is useful when you’re looking at goal-timing or second-half markets.
A simple table helps keep those points in front of you before you pick a market.
Build a team comparison table before making a call
| Factor | Team A | Team B |
|---|---|---|
| Recent form (last 5) | e.g. W-D-W-L-W | e.g. L-W-W-D-L |
| Goals for / against (avg) | e.g. 2.0 / 1.1 | e.g. 1.4 / 0.7 |
| Home / away record | e.g. 8W-2D-0L (home) | e.g. 4W-3D-3L (away) |
| H2H trend (last 5) | e.g. 3 wins | e.g. 1 win |
| Rest days before match | e.g. 6 days | e.g. 3 days |
| Travel demands | e.g. Home fixture | e.g. Away after long travel |
The biggest differences usually show up in rest, travel, and motivation. Once the matchup context is clear, move to team news and playing style.
Step 3: Check team news, line-ups, and playing style
Once you’ve looked at the matchup, team news can either back up your view or flip it on its head.
A confirmed injury to a key midfielder or a late suspension can change how a team sets up, how they press, and how much threat they carry on the day.
Check injuries, suspensions, and rotation risk
Start with the key positions:
- Goalkeeper
- Centre-backs
- Holding midfielder
If one of those players is missing, the effect often runs through the whole side.
And don’t stop at who is out. Check who comes in.
A defensive replacement for a box-to-box midfielder can push a team from proactive to reactive. That shift can change which markets make sense. Fixture congestion can also lead to early substitutions or surprise benchings. If a key player is carrying a muscle issue or facing a late fitness test, it’s often better to wait for confirmed team news before placing a bet.
Absences matter because they can alter the team’s shape and pressing plan. Once the line-up is out, check whether the tactical setup still suits the opponent.
Match playing styles to the opponent
Next, compare how each team’s style lines up against the other.
Style clashes can decide a match. A high-press side that loses its midfield anchor may press unevenly and leave space behind for a counter-attacking team. On the flip side, a compact counter-attacking side can struggle when forced to play against a disciplined press that cuts down time on the ball.
Put simply: tactical fit can matter just as much as form.
List each team’s strengths and weaknesses in a table
| Factor | Team A | Team B |
|---|---|---|
| Key absentees | A suspended playmaker | An injured centre-back |
| Replacement quality | Defensive replacement | Weak backup |
| Tactical style | Counter-attacking, compact mid-block | High press, wide pace |
| Fixture fit | Suits a slower tempo | May struggle against quick transitions |
| Depth risk | Thin in midfield | Limited backup in defence |
Use the table to compare the matchup at a glance. Then use it to narrow down the best market.
Step 4: Match your research to the right soccer market
Your research only helps if it leads you to the right market. The key is simple: ask which market lines up best with the evidence you’ve gathered.
Every decimal odd carries an implied probability. Odds of 2,00 imply a 50% chance, while 3,00 implies 33,3%. If your research says the actual chance is higher than the odds suggest, that’s where the value is. You’re looking for spots where the market has priced the probability badly.
Use the form, context, and team-news notes from Steps 1 to 3 to decide which market fits best.
Link team patterns to common markets
Use the Step 3 table to connect each pattern to a market.
| What your research shows | Market to consider |
|---|---|
| Strong home/away split | Match Result (1X2) |
| Both teams score often | Both Teams to Score – Yes |
| One side has a solid defensive record | Both Teams to Score – No |
| High average goals per game on both sides | Over 2.5 Goals |
| Low-scoring match profile | Under 2.5 Goals |
| Clear quality gap | Asian Handicap |
| Likely winner, but draw risk remains | Draw No Bet |
This is where pattern-matching matters. If two sides keep scoring and conceding, Both Teams to Score – Yes may make more sense than trying to pick a winner. If one team is better but draws keep popping up in that league or matchup, Draw No Bet can give you a bit more cover.
About 25% of PSL matches end level. So if your research doesn’t clearly point to one side, Double Chance or Draw No Bet can be safer than forcing a 1X2 pick.
Use the Supabets soccer page to compare your read with the fixtures and odds on offer.
Keep a short research log for future fixtures
After the bet, write down what the data pointed to and whether the market matched the shape of the match.
A short log is enough. Note:
- The fixture
- Your main reasons
- The market
- The result
Do that over a run of fixtures and patterns start to show. You’ll see which markets you read well, and where your judgement keeps missing the mark.
Conclusion: A four-step method for researching soccer teams
Use the four steps in this order: form, context, team news, then market fit. Then do it again and again until the pattern feels natural.
Run the same checklist on every fixture.
That habit gets easier when you track each bet. Log the fixture, your reason, the market, and the result. Over time, that log shows where your reads are strong and where they miss.
You can use the Supabets soccer page to put this process into practice on live fixtures and markets.
FAQs
How do I know if the odds offer value?
Odds offer value when your estimated chance of an outcome is higher than the probability built into the bookmaker’s odds.
To work out the implied probability, use:
(1 ÷ decimal odds) × 100
Here’s the simple idea: if the bookmaker’s odds suggest one chance, but your research points to a better one, you may have found a value bet.
You can also check this with expected value:
EV = (Win Probability × Decimal Odds) – 1
If the result is positive, the bet shows value.
When should I avoid a 1X2 bet?
Avoid a 1X2 bet if your pick is based on emotion or team loyalty instead of data.
It’s also worth stepping back if you haven’t checked recent team form, injury updates, or possible squad rotation. A lot of punters keep backing favourites and brush past the draw, but draws account for about 25% to 27% of matches.
If one result doesn’t feel clear-cut, a double chance bet may be a better fit.
How important is confirmed team news?
Confirmed team news matters because it can directly affect a team’s win probability and shift odds by 10% to 20%.
Check injuries, suspensions, and returning players before making a call. A late fitness update or tactical rotation can change expected goals, pressing intensity, and the fair odds before the market reacts.