Advanced sports betting statistics can transform how you approach betting, moving it from guesswork to a data-driven process. By understanding odds, probabilities, win rates, and expected value, you can make smarter decisions and identify opportunities where bookmakers’ odds don’t align with actual probabilities. Here’s a quick breakdown:
- Odds and Probability: Learn to convert odds into percentages to find implied probabilities. For example, odds of 2.00 mean a 50% chance.
- Win Rates: Track your success by calculating wins vs. total bets, but focus on profitability rather than just win percentages.
- Expected Value (EV): Identify value bets by comparing your estimated probabilities with bookmakers’ odds.
- Statistical Models: Use tools like logistic regression or machine learning to predict outcomes based on historical data.
- Performance Metrics: Metrics like Expected Goals (xG) in football or True Shooting Percentage (TS%) in basketball provide deeper insights into team and player performance.
Key Takeaway: Use advanced stats and models to evaluate odds, manage your bankroll, and create a disciplined betting strategy. Platforms like Supabets give you access to tools and data to implement these strategies effectively.
Mathematically Sound Sports Betting
sbb-itb-00c3b18
Core Statistical Metrics for Sports Betting
Sports Betting Statistics Guide: Odds Conversion and Expected Value Calculator
When it comes to sports betting, understanding the numbers behind the markets is what separates informed decisions from blind luck. At the heart of any data-driven betting approach are three key metrics: odds and probability, win rates, and expected value. Each of these provides a unique lens through which to evaluate potential betting opportunities.
Odds and Probability Explained
Odds reflect a bookmaker’s estimation of how likely an outcome is. Here’s the catch: the relationship between odds and probability is inverse. Lower odds suggest a higher likelihood, while higher odds indicate a lower chance of the event happening. Elna Dlamini from BetMentor simplifies it:
"Low odds suggest a higher likelihood of the outcome, while high odds imply a lower likelihood."
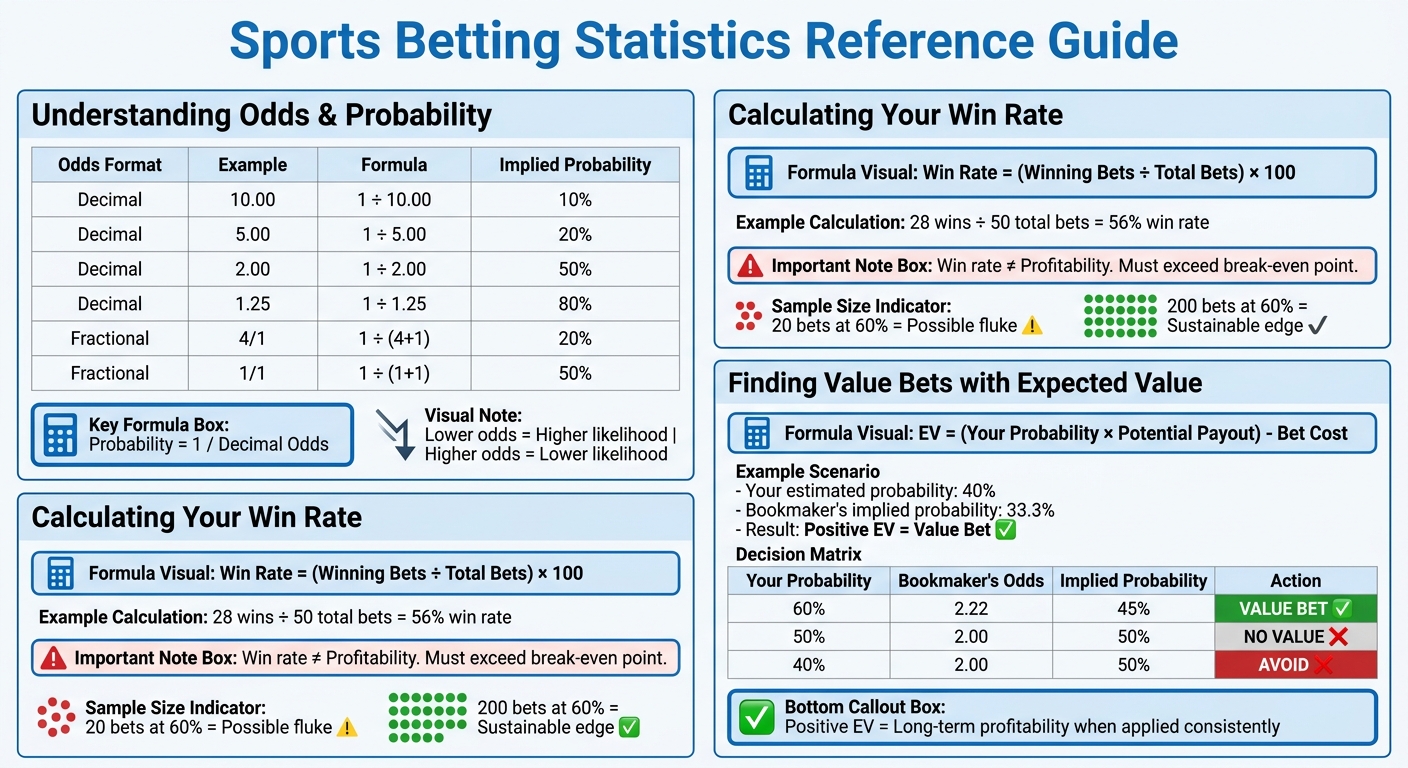
To make smarter bets, you need to convert odds into implied probabilities. For decimal odds – commonly used in South Africa – the formula is:
Probability = 1 / Decimal Odds
Let’s break it down with examples:
- Odds of 2.00 mean a 50% chance of the outcome.
- Odds of 5.00 translate to a 20% likelihood.
- Odds of 1.25 imply an 80% probability.
Here’s a quick reference table for odds conversion:
| Odds Format | Example | Implied Probability Calculation | Implied Probability (%) |
|---|---|---|---|
| Decimal | 10.00 | 1 / 10.00 | 10% |
| Decimal | 5.00 | 1 / 5.00 | 20% |
| Decimal | 1.25 | 1 / 1.25 | 80% |
| Fractional | 4/1 | 1 / (4 + 1) | 20% |
| Fractional | 1/1 (Evens) | 1 / (1 + 1) | 50% |
Always convert odds into percentages before placing your bets. For instance, if your research points to a 60% chance of a team winning, but the odds imply only a 45% probability, you’ve uncovered a potential value bet. Keep in mind that odds can change due to factors like last-minute injuries or unexpected weather conditions.
Win Rates and Loss Rates
Your win rate is a straightforward calculation: divide the number of successful bets by the total bets placed. For example, if you’ve won 28 out of 50 bets, your win rate is 56%. But don’t let this number fool you – profitability depends on exceeding your break-even point, which factors in your stake and any commission taken by the bookmaker.
Tracking your win and loss rates over time can reveal trends that aren’t immediately obvious. For instance, a team might have a strong overall record but consistently underperform in away games during winter. By analysing historical data, you can spot patterns like how teams fare under specific conditions or against particular opponents. While a 60% win rate over 20 bets might be a fluke, that same rate over 200 bets suggests you’ve found a sustainable edge.
Value Betting and Expected Value
Value betting is all about finding opportunities where the odds are in your favour – where the potential reward outweighs the risk. This involves comparing the bookmaker’s implied probability with your own assessment. As Bet Central puts it:
"Knowing whether the odds are in your favour or not has always been key to a winning sport betting strategy."
To determine whether a bet has value, you can calculate its Expected Value (EV). Here’s how:
- Multiply your estimated probability of an event by the potential payout.
- Subtract the cost of the bet.
For example, if you estimate a team’s win probability at 40%, but the odds suggest only 33.3%, you’ve identified a positive EV bet. While a positive EV won’t guarantee an individual win, it indicates long-term profitability if applied consistently across multiple bets.
Another tip: shop around for the best odds. Different bookmakers often price the same outcome differently. Securing the highest payout can make a significant difference to your returns over time. By focusing on value and expected returns, you can transform betting from guesswork into a disciplined, strategic activity grounded in statistics. These fundamental metrics lay the groundwork for more advanced predictive models and a refined betting strategy.
Statistical Models for Outcome Prediction
Once you’ve got a handle on odds, probabilities, and expected value, it’s time to explore how statistical models can refine your predictions. These models analyse historical data to uncover patterns that might not be immediately obvious. While they won’t guarantee success, they provide a structured, data-driven way to assess matches and spot potential edges that the market might overlook. This approach lays the groundwork for diving into regression techniques, machine learning, and performance metrics.
Regression Analysis for Sports Betting
Logistic regression is a go-to method for converting historical data into probabilities of outcomes. Unlike linear regression, which predicts continuous outcomes like scores, logistic regression focuses on categorical outcomes – win, loss, or draw. It uses factors like home advantage, recent form, and Elo rating differences to generate probabilities between 0% and 100%.
For example, a 2025 study on international football matches found that logistic regression achieved a test accuracy of about 61%. In Major League Baseball, similar models have shown an accuracy of around 56%. As SignalOdds puts it:
"Its popularity endures because it strikes an ideal balance between simplicity, interpretability, and predictive power."
One of its biggest strengths is its transparency – you can clearly see which variables influence the predictions.
A practical application involves comparing the model’s probabilities to the bookmaker’s implied odds. For instance, if your model predicts a 55% chance of a home win, but the odds imply only a 48% chance, you may have identified a value bet. This method can help you evaluate opportunities on platforms like Supabets Sports.
For games with three possible outcomes (like football’s win/draw/loss), multinomial logistic regression extends the basic framework to handle multiple categories. Meanwhile, Poisson regression is particularly useful for predicting counts, such as the number of goals in a match. Both techniques are straightforward benchmarks, helping you decide whether more advanced models are worth the extra effort.
Machine Learning for Prediction
Machine learning takes prediction a step further by capturing complex, non-linear relationships that regression models might miss. For instance, a team’s home advantage might interact with factors like player fatigue in ways that are hard to model with traditional methods. Algorithms like XGBoost and Random Forests excel at identifying these patterns across large datasets, making them a powerful tool in sports betting.
In April 2026, Prediction Engine shared that their MLB Moneyline model, built with a 51-feature XGBoost algorithm, reached 64.2% accuracy when filtered for a 60%+ confidence threshold across 491 plays. The model incorporated 24 team strength metrics, 24 pitcher-related metrics, and 3 series context features. This highlights how well-designed machine learning models can outperform simpler methods.
However, more data doesn’t always mean better results. The same report showed that reducing an MLB Totals model from 43 features to just 27 team-level metrics (removing noisy pitcher-specific data) boosted backtest accuracy from 65.2% to 68.8%. This underscores the importance of thoughtful feature selection.
To ensure reliable predictions, always use walk-forward backtesting. Train your model on past data and test it on future matches – this respects the time-sequential nature of sports events. Avoid random train-test splits, as they can lead to misleading results. Also, watch out for data leakage, where your features inadvertently include information from the future, inflating accuracy in tests but failing in real-world scenarios.
Start with logistic regression as your baseline. If more complex methods like XGBoost or neural networks don’t significantly outperform it, the added complexity might not be worth it. Gradient boosting algorithms like XGBoost are popular because they handle missing data well and update quickly, but they’re only as good as the data you feed them.
Player and Team Performance Metrics
While models help with predictions, performance metrics provide the raw data that powers them. Choosing the right metrics can make or break a model’s accuracy. In football, Expected Goals (xG) has become a standout metric, offering an objective measure of scoring opportunities. Steffen Fonvig, Founder & Editor-in-Chief at StatsBet, explains:
"Expected Goals (xG) is the single most predictive statistic for future match outcomes."
Metrics like Expected Goal Difference (xGD) – the difference between xG and xGA – are especially valuable. Research shows that a team’s xG over an 8–10 match window predicts future performance better than its actual goal record. For instance, during the 2024–25 Premier League season, home teams averaged 1.55 goals per game compared to 1.18 for away teams, emphasising the influence of venue data.
In basketball, metrics like Defensive Rating (DRtg), Effective Field-Goal Percentage (eFG%), and True Shooting Percentage (TS%) measure offensive and defensive efficiency per possession.
It’s important to avoid metrics that describe style rather than effectiveness. For example, possession percentage and pass completion rates often don’t correlate strongly with winning. Instead, focus on metrics like Passes Per Defensive Action (PPDA), which offer insights into pressing intensity and tactical approaches. Also, split metrics by home and away performance, as location often impacts results.
Using data from at least 8–10 matches for football – or a similar period for other sports – helps ensure reliability. Adjusting for opponent quality is also crucial; compare a team’s performance against stronger versus weaker opponents. By prioritising predictive metrics over descriptive ones, you can build models that forecast future outcomes rather than just summarising past events.
How to Apply Betting Statistics
Turning analytical tools into practical betting strategies is where the magic happens. The difference between making informed decisions and taking educated guesses often lies in how well you can bridge the gap between theory and application. By following a structured approach, you can turn raw data into actionable insights – whether you’re preparing before kick-off or reacting to live match developments.
Building a Data-Based Betting Strategy
Start with a routine. Before placing a bet, review the last five matches for each team, paying close attention to their form, home and away records, recent injuries, and head-to-head stats. These factors provide a clearer picture of what to expect.
Focus on bets where your calculated probability outperforms the odds implied by bookmakers. For instance, if your analysis shows a team has a 60% chance of winning, but the odds suggest only a 52% chance, you’ve likely identified a value bet worth exploring on platforms like Supabets.
Leverage Expected Goals (xG) to uncover teams that are underperforming or overperforming based on their underlying play. A team averaging 2.0 xG per match but scoring just 0.8 goals is likely due for a scoring correction. This creates opportunities when betting markets haven’t yet adjusted to these discrepancies.
Bankroll management is non-negotiable. Limit your stakes to 1–3% of your total bankroll per bet. This approach helps you weather inevitable losing streaks. Keep a detailed log of every bet you make – track wins, losses, stake amounts, and bet types. Analysing this data can reveal which markets are profitable for you and which ones drain your funds. This level of self-awareness separates disciplined bettors from those relying purely on instinct.
Using Statistics for Live Betting
Live betting builds on pre-match analysis, using real-time data to identify fleeting opportunities. Bookmakers’ algorithms often react to scoreline changes but may overlook the actual flow of the game. For example, if a favourite concedes an early goal despite dominating possession and xG, their lengthened odds could present value. As Steffen Fonvig, Founder & Editor-in-Chief at StatsBet, puts it:
"A live betting strategy works when it identifies situations where your assessment of probability consistently differs from the odds offered, and differs in your favour."
Keep an eye on xG divergence during matches through live data platforms. If a team has accumulated 1.8 xG but hasn’t scored, they’re likely to find the net soon. On the other hand, a team that has scored twice from just 0.4 xG is overperforming and may be at risk of conceding.
Here’s how xG data can guide your live bets:
| Team xG | Actual Goals | Situation | Potential Live Bet |
|---|---|---|---|
| 1.8 | 0 | Significantly underperforming | Team to score next / BTTS Yes |
| 2.2 | 1 | Moderately underperforming | Team to score again / Over goals |
| 0.4 | 2 | Significantly overperforming | Opponents to score next |
| 0.8 | 0 | Slightly underperforming | Proceed with caution; low value |
Timing is everything in live betting. The final 15 minutes of a match often see a surge in corners and scoring chances.
Be cautious with cash-outs. Only cash out when circumstances change significantly – like a red card or a key injury – not out of nervousness. Cash-out options often include margins that reduce the value of your bet. Staying disciplined can help you maintain a data-driven approach.
Common Statistical Mistakes to Avoid
One of the biggest mistakes is overreacting to scorelines without context. An early goal doesn’t always reflect the overall performance. Bookmakers may overadjust odds, but deeper analysis often reveals better opportunities.
Misinterpreting xG is another common error. While xG is a powerful tool, it doesn’t account for factors like finishing quality or exceptional goalkeeping. Some players consistently outperform their xG due to superior skills, while others underperform. Similarly, a top-tier goalkeeper can skew results by saving high xG chances.
Avoid relying on small sample sizes. Drawing conclusions from a single half or just two matches often leads to misleading insights. For football, aim to analyse data from at least 8–10 matches for more reliable conclusions. Always adjust for the quality of opponents – a team’s performance against weaker sides won’t necessarily translate against stronger competition.
Context matters. Numbers alone can’t capture everything, like player motivation during relegation battles, weather conditions, or tactical changes after a red card. Watching matches can provide insights into body language, energy levels, and tactical shifts that statistics can’t fully explain.
Lastly, don’t overlook player availability. If a team’s star scorer, playmaker, or captain is missing due to injury or suspension, their historical stats might not hold up. Always check team news before placing bets and adjust your expectations when key players are absent.
Conclusion
Advanced statistics have transformed sports betting from a game of chance into a calculated discipline. By diving into performance metrics beyond simple win-loss records, you can uncover insights that help you find value bets, recognise patterns, and make decisions based on data rather than gut feelings or guesswork.
Research backs this up: 71% of sports bettors who incorporate statistical analysis report better decision-making, and 56% see improved profitability. In fact, one study revealed that bettors using statistical methods increased their profits by 25% compared to those who didn’t. These aren’t minor improvements – they can mean the difference between consistent success and costly errors. By applying these insights, your betting strategy becomes structured and responsive.
The real strength of advanced statistics lies in their regular, thoughtful use. Consistency matters. When you rely on maths and models for every decision, you turn betting into a strategic process rather than a gamble. As Paruyr Shahbazyan, Founder of RG.org, aptly puts it:
"Innovation in sportsbetting comes from a deep understanding of both technology and the human element of sports".
Focus on markets where your analysis identifies genuine opportunities. Over time, fine-tune your models based on what proves effective. The aim isn’t to achieve perfection but to continuously improve with the help of data.
FAQs
How do I work out my break-even win rate from decimal odds?
To figure out your break-even win rate, simply divide 1 by the decimal odds. This calculation shows the percentage of wins you need to avoid losses. For instance, if the decimal odds are 1.91, the formula looks like this: 1 ÷ 1.91 = 52.4%. In this case, you’d need to win at least 52.4% of the time to make the bet worthwhile over time.
How can I tell if my probability estimate is realistic or biased?
To determine whether your probability estimate is realistic or skewed, compare its expected value to the actual parameter. The difference between the expected value of your estimate and the true parameter reveals potential bias. A positive difference suggests overestimation, while a negative one points to underestimation.
What’s a simple way to start modelling match outcomes without overfitting?
When building models to predict match outcomes, it’s best to start small. Begin with a straightforward approach that uses just one or a handful of key statistics. This keeps the model balanced and prevents it from being overly tuned to historical data. Once you’ve established a reliable base, you can slowly introduce additional features. Keeping things simple at the start ensures the model stays broadly applicable and effective.